A comprehensive Tableau dashboard analyzing customer behavior, sales performance, and profitability. Track key metrics, identify top customers, and monitor growth trends for 2023.
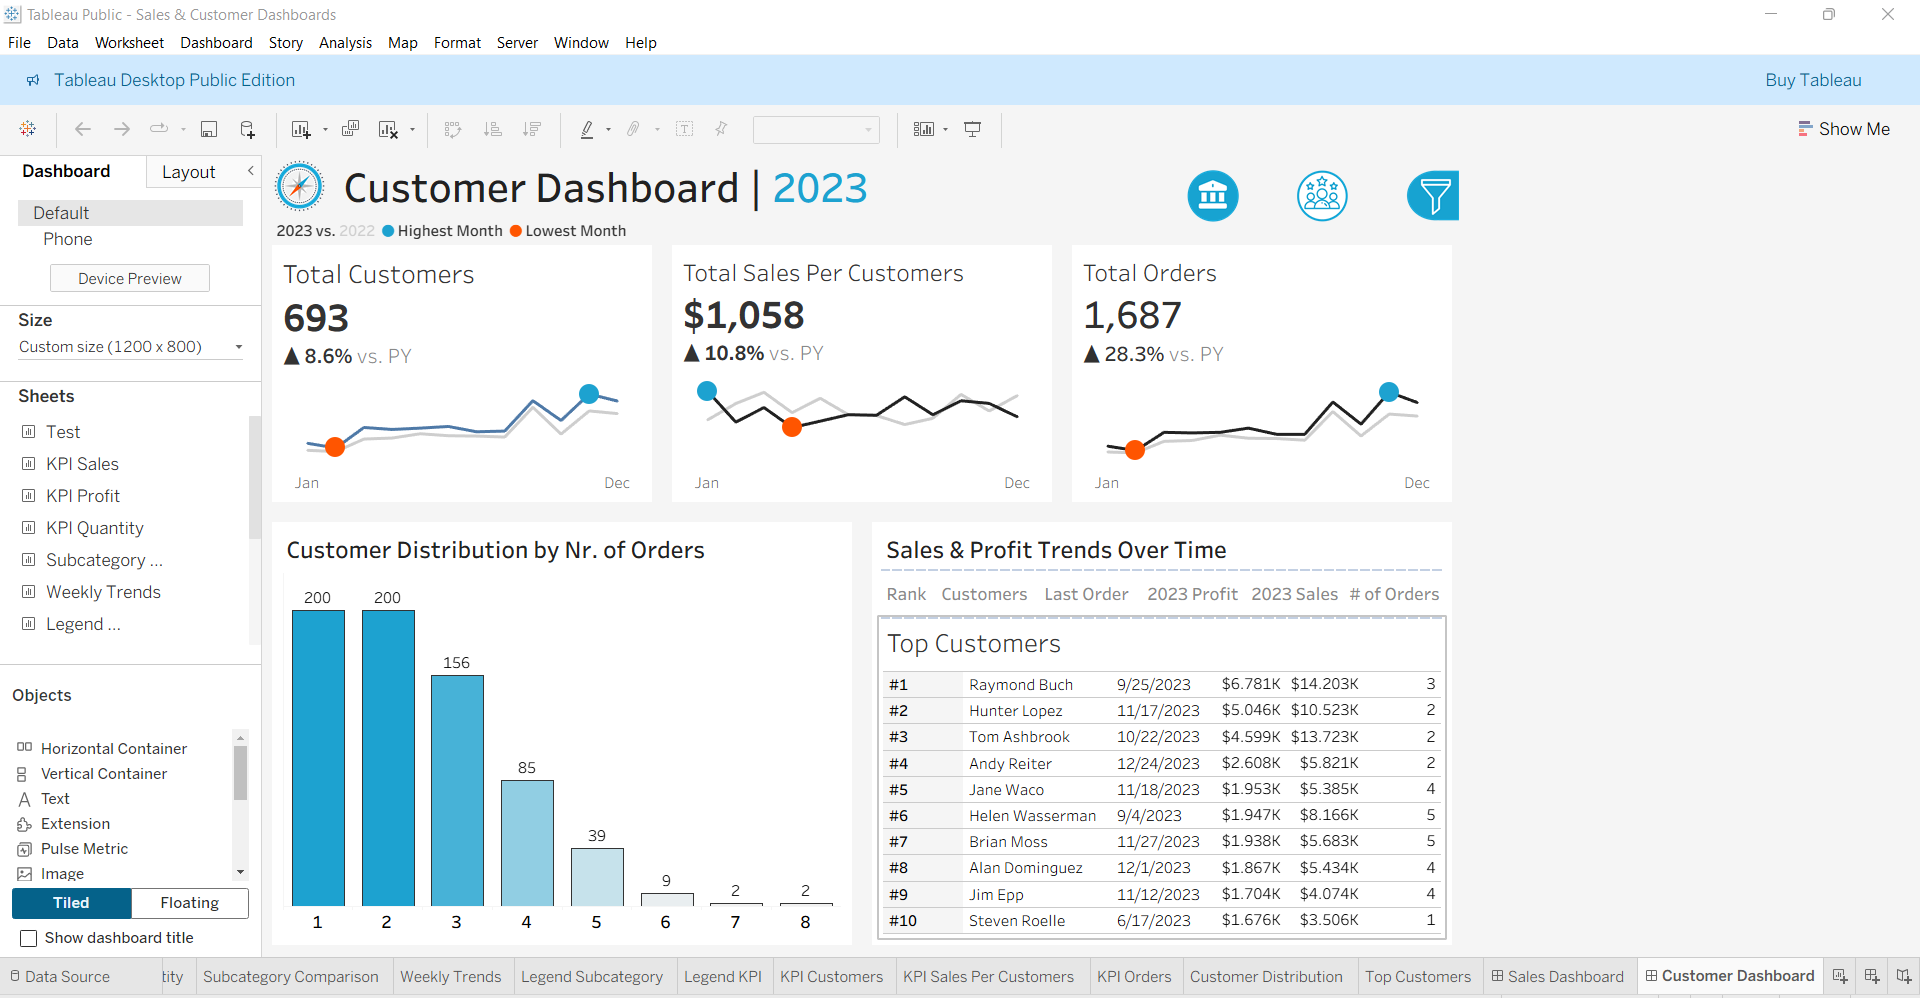
| Rank | Customer Name | Last Order | 2023 Profit | 2023 Sales |
|---|---|---|---|---|
| #1 | Raymond Buch | 9/25/2023 | $6.781K | $14.203K |
| #2 | Hunter Lopez | 11/17/2023 | $5.046K | $10.523K |
| #3 | Tom Ashbrook | 10/22/2023 | $4.599K | $13.723K |
| #4 | Andy Reiter | 12/24/2023 | $2.608K | $5.821K |
| #5 | Jane Waco | 11/18/2023 | $1.953K | $5.385K |
| #6 | Helen Wasserman | 9/4/2023 | $1.947K | $8.166K |
| #7 | Brian Moss | 11/27/2023 | $1.938K | $5.683K |
| #8 | Alan Dominguez | 12/1/2023 | $1.867K | $5.434K |
| #9 | Jim Epp | 11/12/2023 | $1.704K | $4.074K |
| #10 | Steven Roelle | 6/17/2023 | $1.676K | $3.506K |
Data reflects 2023 performance, sorted by highest profit contribution.
The dashboard includes a dynamic chart showing how customers are distributed based on the number of orders placed. Peaks observed in January and December indicate seasonal shopping behavior.
This dashboard is built on a custom dataset containing transaction history, customer demographics, and order details. All numbers are up‑to‑date as of December 2023.
Click on the images to see a larger preview of the Customer Dashboard.
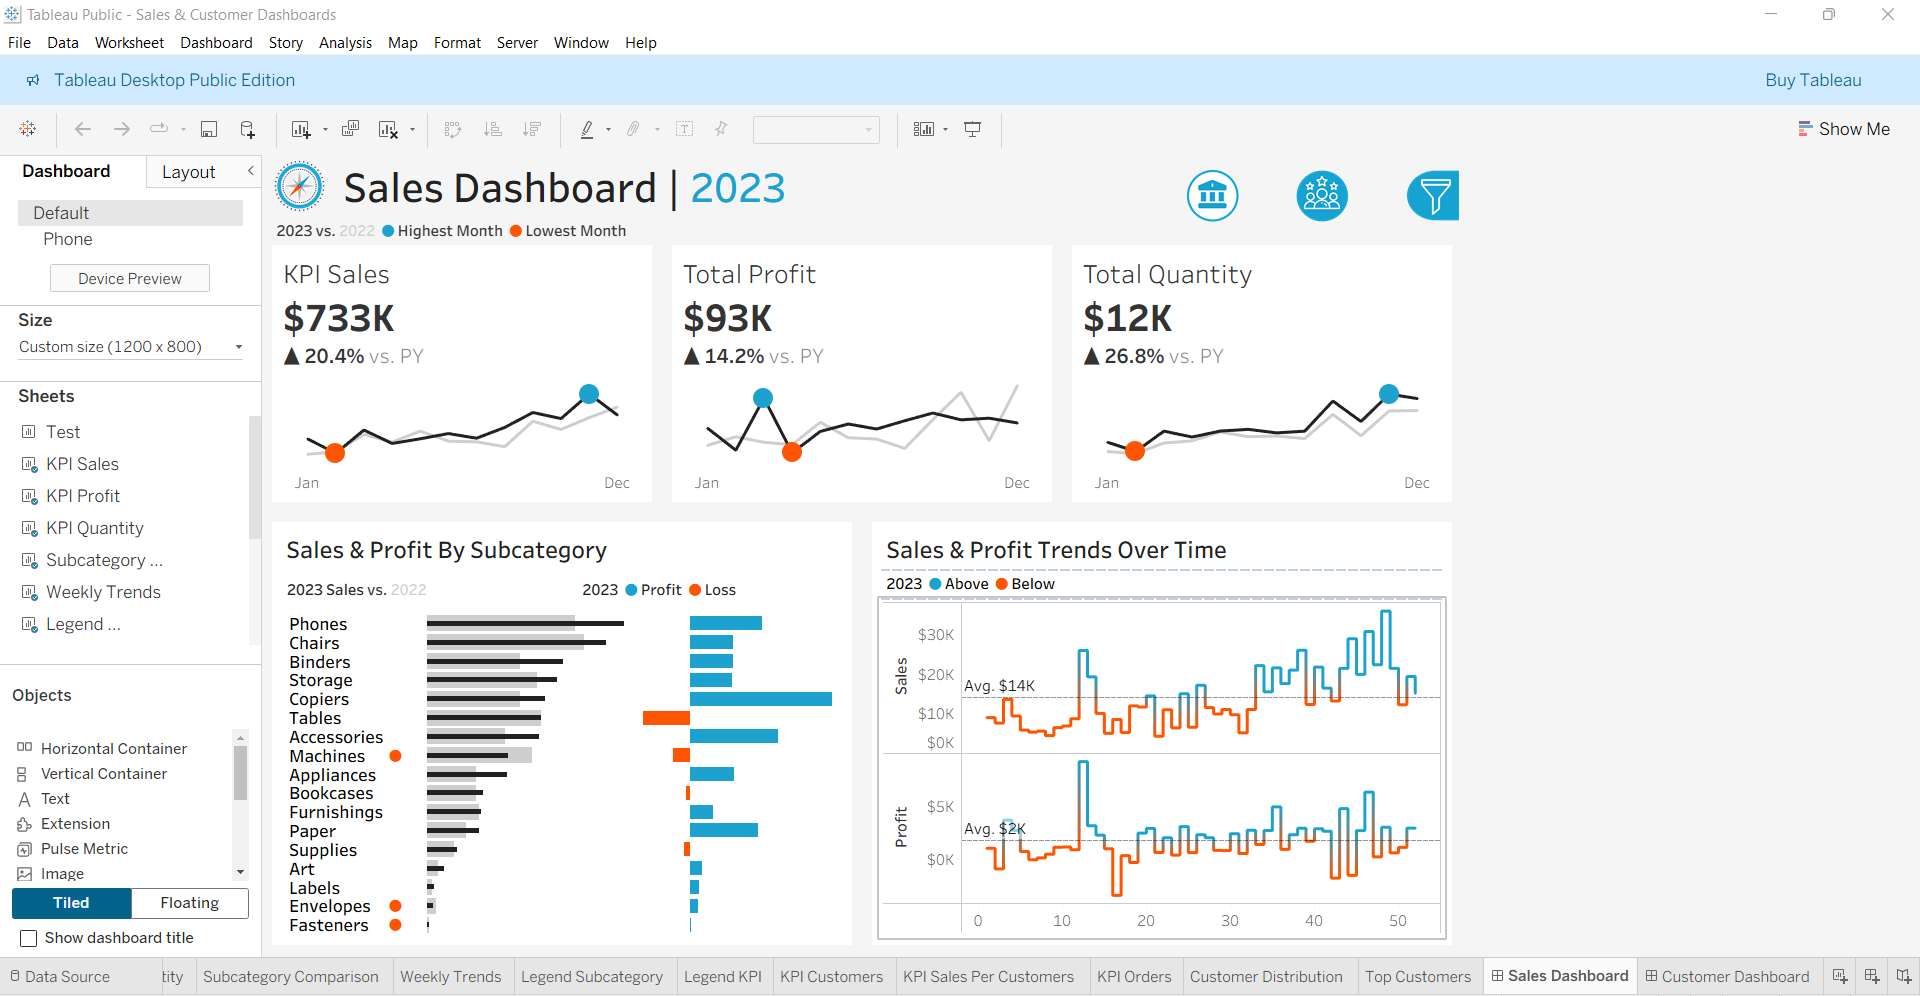
Sales Dashboard
Customers Analysis

Data analyst passionate about transforming raw data into compelling visual stories. This dashboard reflects a commitment to clarity, interactivity, and business impact.
👉 If you find this project insightful, give it a ⭐ on Tableau Public!