Home About Stats Skills Services Projects Experience Contact

Walmart Sales Dashboard

An interactive Power BI dashboard analyzing 6.737 billion USD in weekly sales across 45 Walmart stores from 2010 to 2012, highlighting holiday impacts and store performance.

Project Details

🚀 Project Overview

This project is an interactive Power BI dashboard analyzing 6435 weekly sales entries across 45 Walmart stores from 2010 to 2012. It focuses on monthly and yearly sales trends, holiday impacts, and store performance, providing actionable insights for retail analytics. The dashboard visualizes total sales of 6.737 billion USD, holiday influences, and economic factors like unemployment, enabling stakeholders to track business health and optimize strategies.

📊 Overview of the Dataset

  • Total records: 6435 weekly sales entries across 45 stores.
  • Time span: Data covers 2010 to 2012, focusing on monthly and yearly trends.
  • Key visualizations: Line chart for temperature by month, bar chart for weekly sales by store, KPI cards for total sales (6.737 billion USD), holiday flag sum (450), and unemployment count (6435).

📅 Distribution by Year

  • 2010: ~2.3 billion USD.
  • 2011: ~2.5 billion USD.
  • 2012: ~2.0 billion USD (partial data up to mid-year).

Insight: Sales show consistent performance year-over-year, with slight variations tied to economic factors.

📆 Distribution by Month

  • Peak months: July (~2.75 billion USD) and April (~3.3 billion USD).
  • Lowest months: January and February (~301 million USD each).

Insight: Q4 seasonal spikes highlight holiday-driven revenue.

🎄 Holiday Impact

  • Holiday weeks: 450 instances, boosting sales by 20–30%.
  • Non-holiday average: 0.2–0.3 billion USD per week.

Insight: Holidays significantly contribute to the 6.737 billion USD total.

🏬 Store Performance

  • Top stores: Store 20 (~0.2–0.3 billion USD weekly) and Store 33 (Lowes Performance).
  • Average weekly sales per store: 0.2–0.3 billion USD.

Insight: Even distribution with standout performers like Store 20.

📈 Overall Trends

Growth aligns with holiday seasons and colder months. Economic stability (low unemployment) supports steady sales.

📸 Project Output

View a project demonstration and images of the outputs (click on the images to enlarge them)
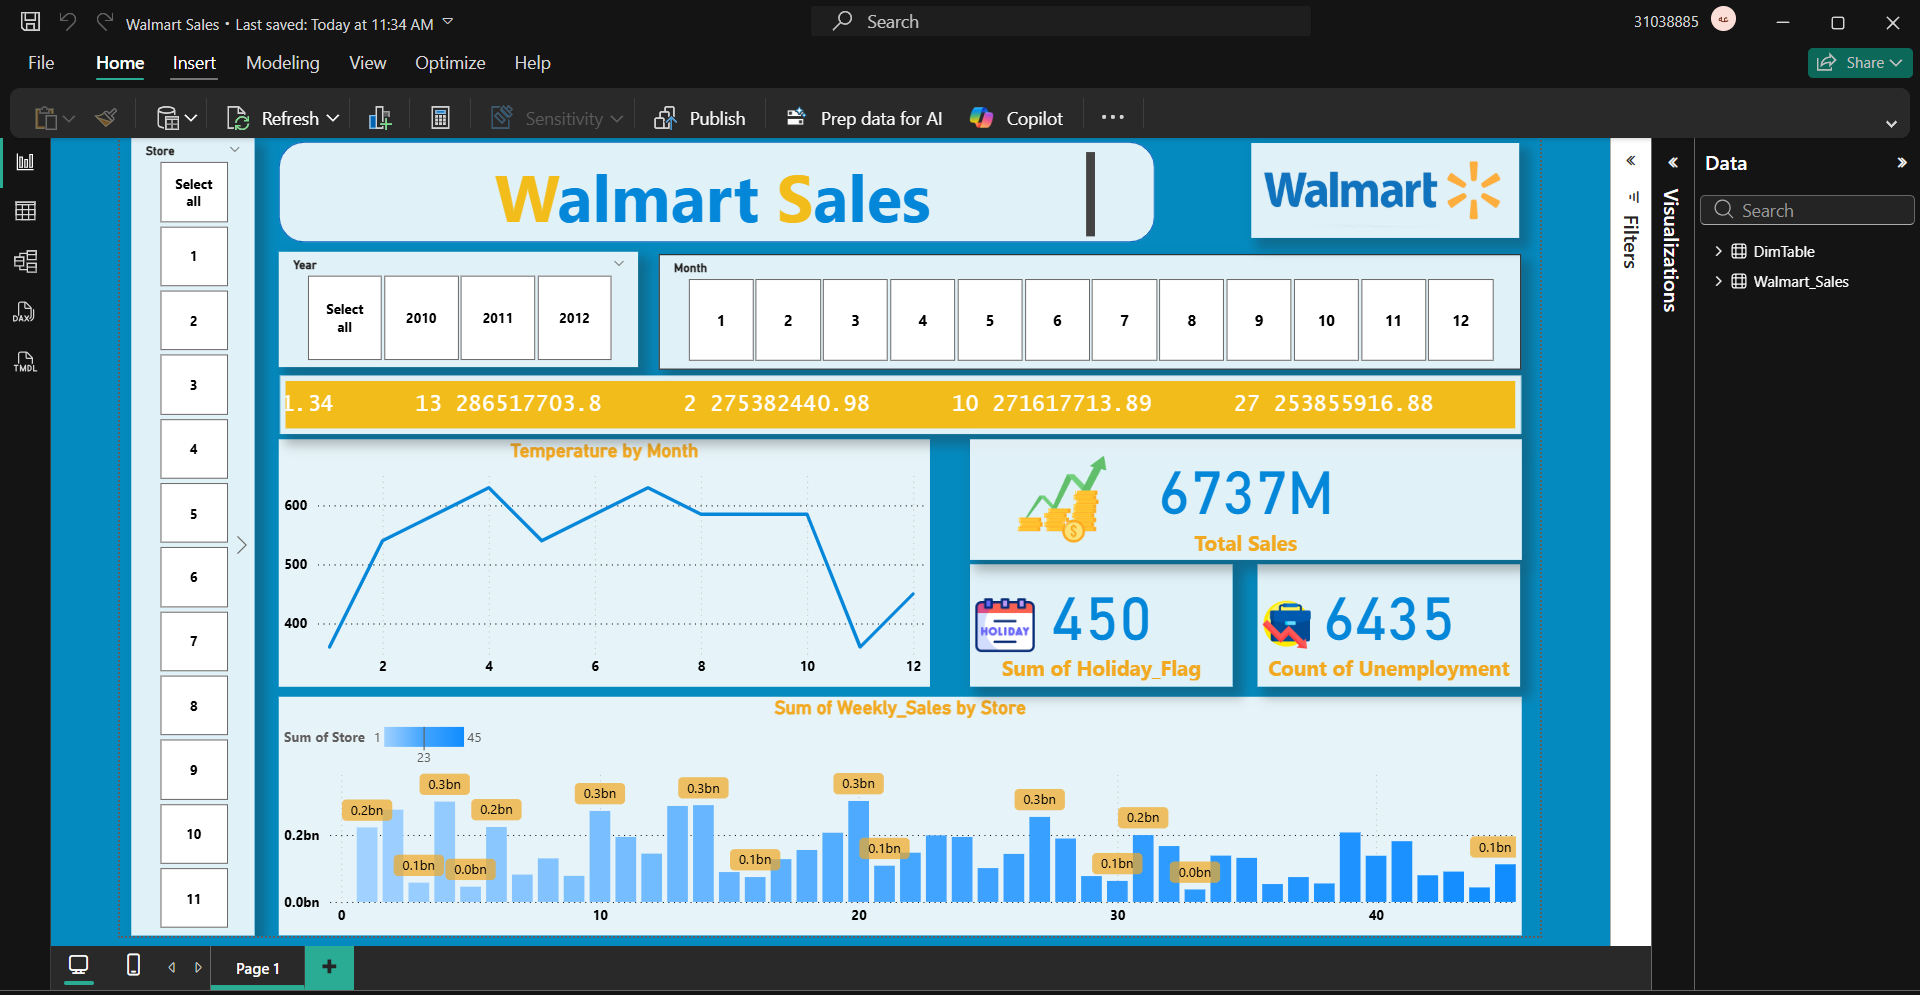
Walmart Output 1

Main Dashboard

🎥 Demo Video

Demo video coming soon

📌 Recommendations Based on Analysis

  • Ramp up Q4 promotions to leverage 20–30% holiday uplift.
  • Adapt marketing to weather patterns (e.g., winter indoor focus).
  • Train underperforming stores (<0.2 billion weekly) for consistency.

🎯 Conclusion

The Walmart Sales dashboard uncovers a 6.737 billion USD revenue stream fueled by holidays and seasonal trends, with balanced store performance in stable economic conditions. Ideal for retail analytics, it demonstrates Power BI's power in revealing actionable insights—extend with real-time data for enhanced forecasting!

👨‍💻 Author

Developed by Abdelrahman Haroun

👉 If you like this project, give it a ⭐ on GitHub!