A Power BI dashboard designed to analyze business performance (2015-2017), visualizing revenue, profit, orders, and customer transactions for strategic decision-making.
This project, named AMIT BI, is a Power BI dashboard designed to analyze the performance of a business (likely a retail or e-commerce entity) over the years 2015-2017. The goal is to automate product data collection (revenue, profit, orders, and customer transactions) and visualize it into an interactive dashboard for further analysis. This project showcases data transformation skills.
This dashboard can be used by analysts, managers, or businesses to:
Sourced from a structured dataset (likely CSV or database) containing sales, customer, and product details.
Handled missing values and ensured consistency for accurate visualization.
Designed multiple pages (Overview, Product, Customer Tooltip, Product Details) with:
Implemented filters and tooltips to manage missing elements, with debugging notes for refinement.
Exported insights as interactive visuals and potential CSV exports for further analysis.
Columns include:
For the AMIT BI dashboard, the analysis reveals:
View a project demonstration and images of the outputs (click on the images to enlarge them)
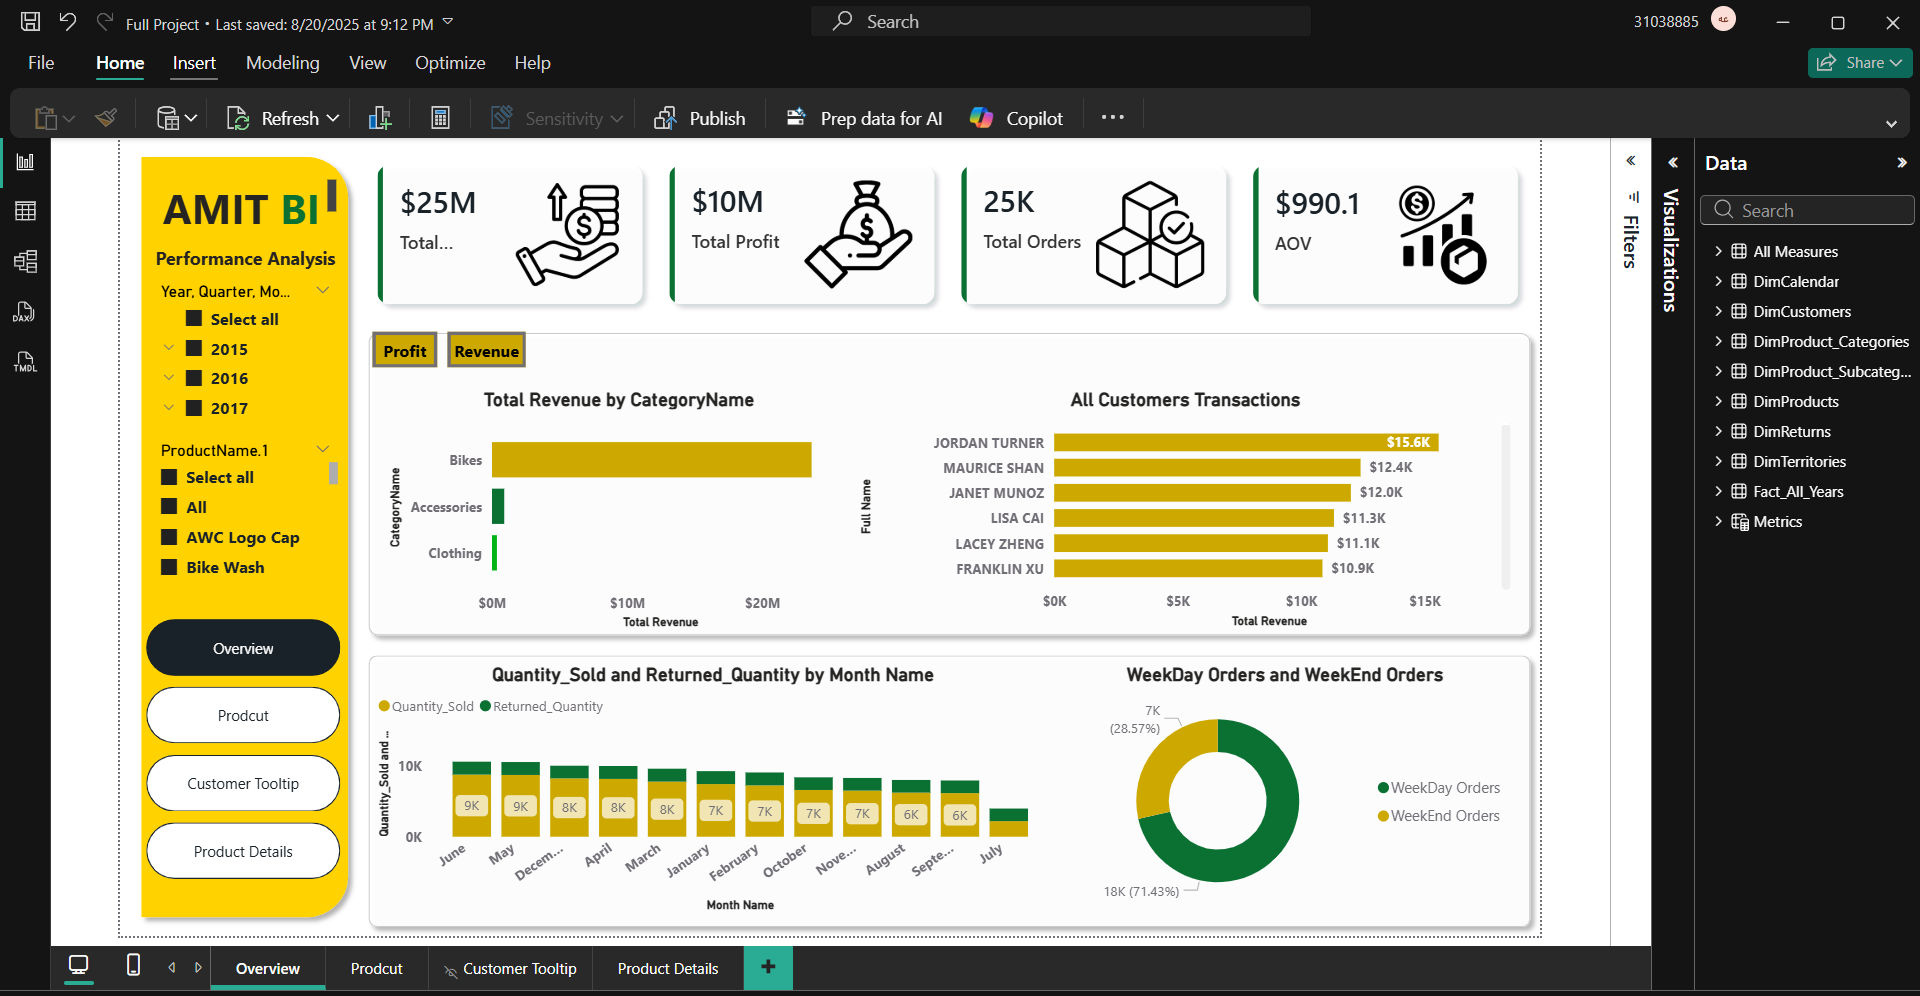
Main Dashboard
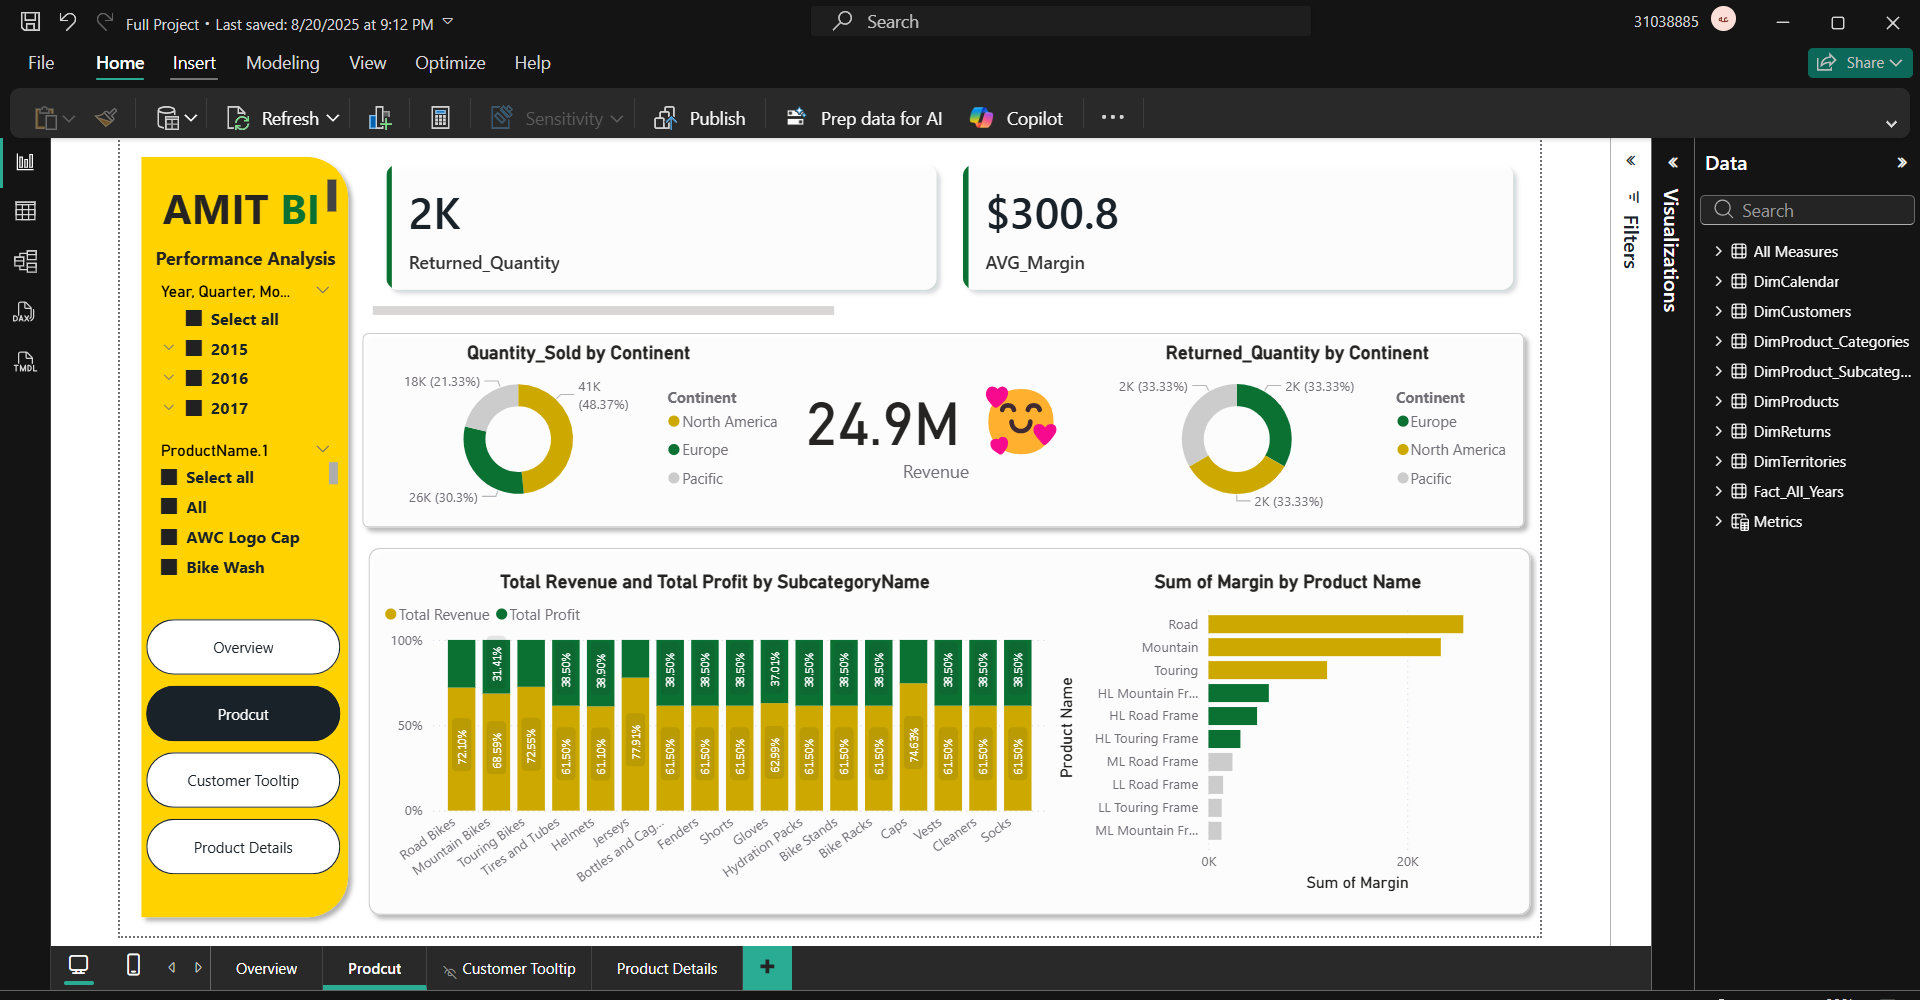
Product Analysis
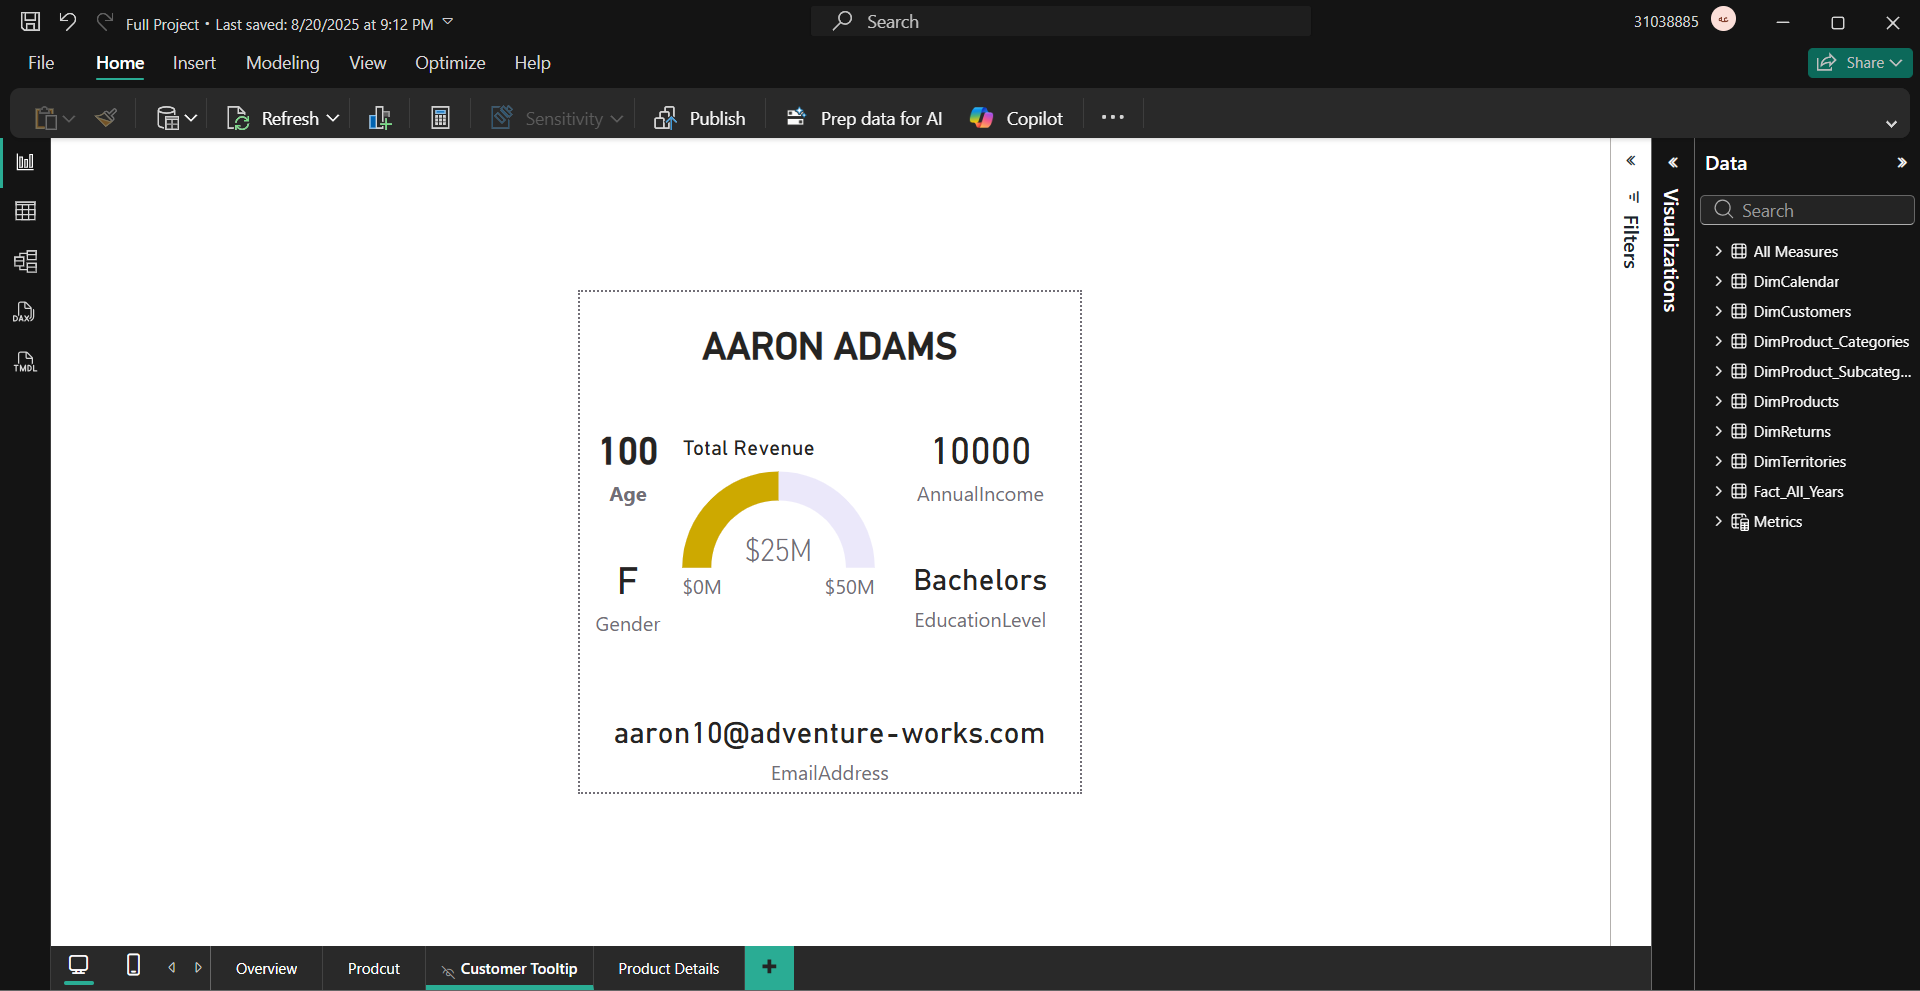
Customer Tooltip
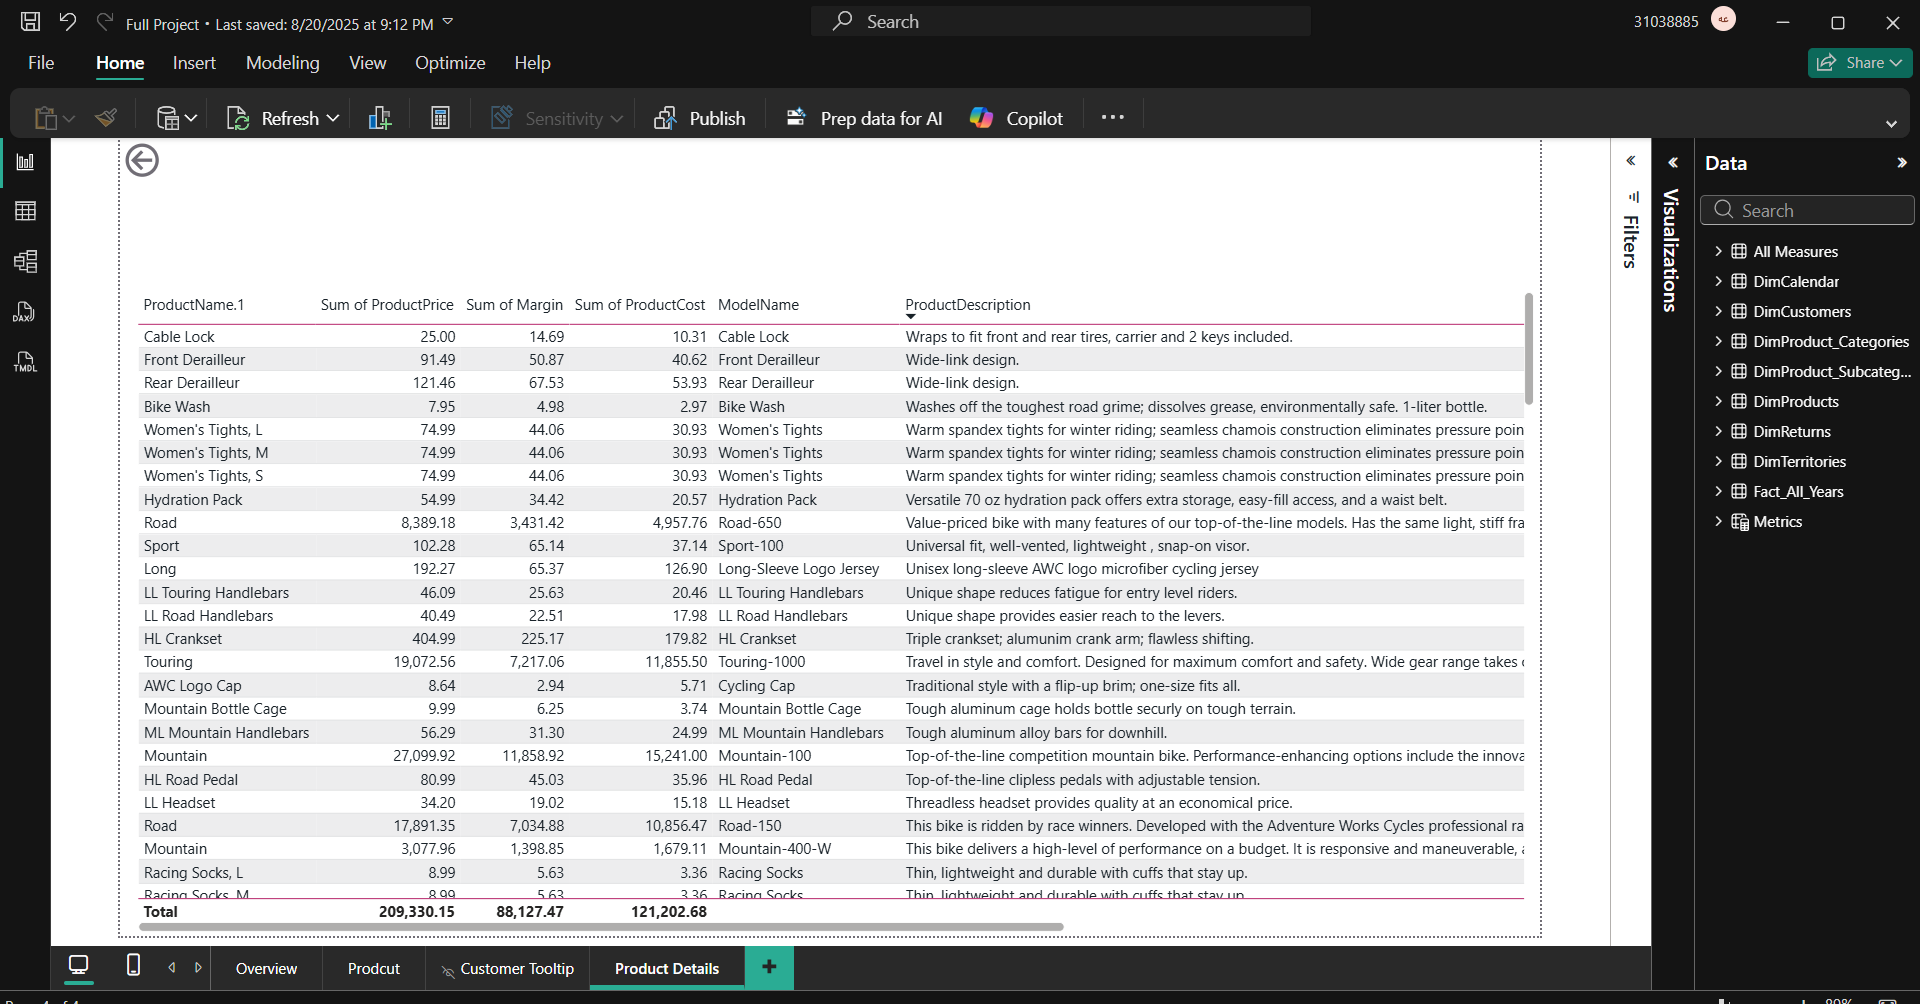
Product Details
This project demonstrates real-world business intelligence skills that can be applied in:
It's a solid foundation for data-driven decision-making in retail and marketing.